Project Details
Web Vitals Monitoring Dashboard
Comprehensive Web Vitals tracking system with attribution data, backend logging, and analytics dashboards.
About the Project
Built a production-ready Web Vitals monitoring system using the web-vitals library with attribution support. Implemented tracking for all Core Web Vitals (LCP, CLS, INP, FCP, TTFB) with detailed attribution data, intelligent SPA navigation handling, and backend logging. Collaborated with the data analysis team to create visualizations and alerting systems that enabled data-driven performance optimizations.
Implementation Overview
Built a comprehensive Web Vitals monitoring system using the web-vitals library with attribution support. The system tracks all Core Web Vitals metrics (LCP, CLS, INP, FCP, TTFB) with detailed attribution data, logs metrics to our backend service, and enables data-driven performance optimizations through analytics dashboards and alerting.
Web Vitals Library Integration
Used the web-vitals/attribution package to track Core Web Vitals with detailed attribution data:
// Import web vitals with attribution support
import { onCLS, onLCP, onINP, onFCP, onTTFB } from "web-vitals/attribution";

// Initialize tracking for all Core Web Vitals
export function initWebVitals(logService, eventName, routingMode = "mpa") {
  // Register all core web vitals observers with attribution
  onCLS(processMetric, { reportAllChanges: true });
  onLCP(processMetric, { reportAllChanges: true });
  onINP(processMetric, { reportAllChanges: true });
  onFCP(processMetric, { reportAllChanges: true });
  onTTFB(processMetric, { reportAllChanges: true });

  // Flush metrics on visibility change (user leaving page)
  addEventListener("visibilitychange", () => {
    if (document.visibilityState === "hidden") {
      flushWebVitals();
    }
  }, true);

  // Flush before page unload
  addEventListener("beforeunload", flushWebVitals, true);
}
Metrics Tracking & Attribution
Each metric includes detailed attribution data to identify performance bottlenecks:
// Example: LCP Attribution Extraction
function extractLCPAttribution(metric) {
  const attribution = metric.attribution || {};

  return {
    value: round(metric.value, 0),
    timeToFirstByte: round(attribution.timeToFirstByte || 0, 0),
    resourceLoadDelay: round(attribution.resourceLoadDelay || 0, 0),
    resourceLoadDuration: round(attribution.resourceLoadDuration || 0, 0),
    elementRenderDelay: round(attribution.elementRenderDelay || 0, 0),
    target: String(attribution.target).substring(0, 150),
    url: String(attribution.url).substring(0, 150)
  };
}

// Example: CLS Attribution Extraction
function extractCLSAttribution(metric) {
  const attribution = metric.attribution || {};

  return {
    value: round(metric.value, 4),
    largestShiftTarget: String(attribution.largestShiftTarget).substring(0, 150),
    largestShiftTime: attribution.largestShiftTime,
    largestShiftValue: round(attribution.largestShiftValue, 4),
    largestShiftSource: {
      node: String(attribution.largestShiftSource.node?.outerHTML).substring(0, 150),
      previousRect: { x, y, width, height },
      currentRect: { x, y, width, height }
    }
  };
}

// Example: INP Attribution Extraction
function extractINPAttribution(metric) {
  const attribution = metric.attribution || {};

  return {
    value: round(metric.value, 0),
    interactionTarget: String(attribution.interactionTarget).substring(0, 150),
    interactionType: attribution.interactionType,
    inputDelay: attribution.inputDelay,
    processingDuration: attribution.processingDuration,
    presentationDelay: attribution.presentationDelay,
    longestScript: {
      duration: round(attribution.longestScript.entry.duration, 0),
      invoker: String(attribution.longestScript.entry.invoker).substring(0, 150),
      sourceURL: String(attribution.longestScript.entry.sourceURL).substring(0, 150)
    }
  };
}
SPA Navigation Handling
Implemented intelligent metric flushing for Single Page Application (SPA) navigation to ensure accurate per-route tracking:
// Track route changes in Next.js App Router
export default function WebVitalsApp() {
  const pathname = usePathname();
  const previousPathname = useRef(pathname);

  useEffect(() => {
    // Initialize on mount with MPA mode
    import("../../../../utils/webVitalsTracker").then(module => {
      module.initWebVitals(
        LogServiceApp,
        "WEB_VITALS_ATTRIBUTION_APP",
        "mpa"
      );
    });
  }, []);

  useEffect(() => {
    // Handle route changes (SPA navigation)
    if (previousPathname.current !== pathname) {
      // Flush metrics from previous route
      webVitalsModule.current.flushWebVitals();

      // Update to new route with SPA mode
      webVitalsModule.current.updateRoute(pathname, "spa");
      previousPathname.current = pathname;
    }
  }, [pathname]);
}
Data Logging to Service
Metrics are logged to our backend service with comprehensive context including device info, page type, and routing mode:
// Flush metrics with device and page context
export function flushWebVitals() {
  const eventInfo = {
    // Device Information
    url: location.href,
    pathname: currentPathname,
    referrer: document.referrer,
    userAgent: navigator.userAgent,
    memory: navigator.deviceMemory,
    cpus: navigator.hardwareConcurrency,
    deviceWidth: window.innerWidth,
    deviceHeight: window.innerHeight,
    connection: {
      effectiveType: navigator.connection.effectiveType,
      rtt: navigator.connection.rtt,
      downlink: navigator.connection.downlink
    },

    // Web Vitals Metrics
    metrics: {
      LCP: { value, target, url, timeToFirstByte, ... },
      CLS: { value, largestShiftTarget, largestShiftSource, ... },
      INP: { value, interactionTarget, longestScript, ... },
      FCP: { value, timeToFirstByte, loadState, ... },
      TTFB: { value, dnsDuration, connectionDuration, ... }
    },

    // Context
    routingMode: "mpa" | "spa",
    pageType: "HOME" | "SRP" | "JD" | "OTHER",
    timestamp: new Date().toISOString()
  };

  // Log using deferred logging for better performance
  logService.logEventDefer(
    { name: "WEB_VITALS_ATTRIBUTION", category: "WEB_VITALS" },
    eventInfo
  );
}
Data Pipeline & Analytics
Collected metrics flow through a comprehensive data pipeline enabling real-world performance analysis:
Data Analysis & Visualization
Working with the data analysis team, we created comprehensive visualizations of real-world Web Vitals data:
Performance Dashboards
Created interactive dashboards showing:
- Real-time Core Web Vitals trends across different page types
- Performance breakdown by device type, connection speed, and geographic location
- Attribution analysis identifying specific elements causing performance issues
- Historical trends and performance regression detection
INP Metrics by Page Type
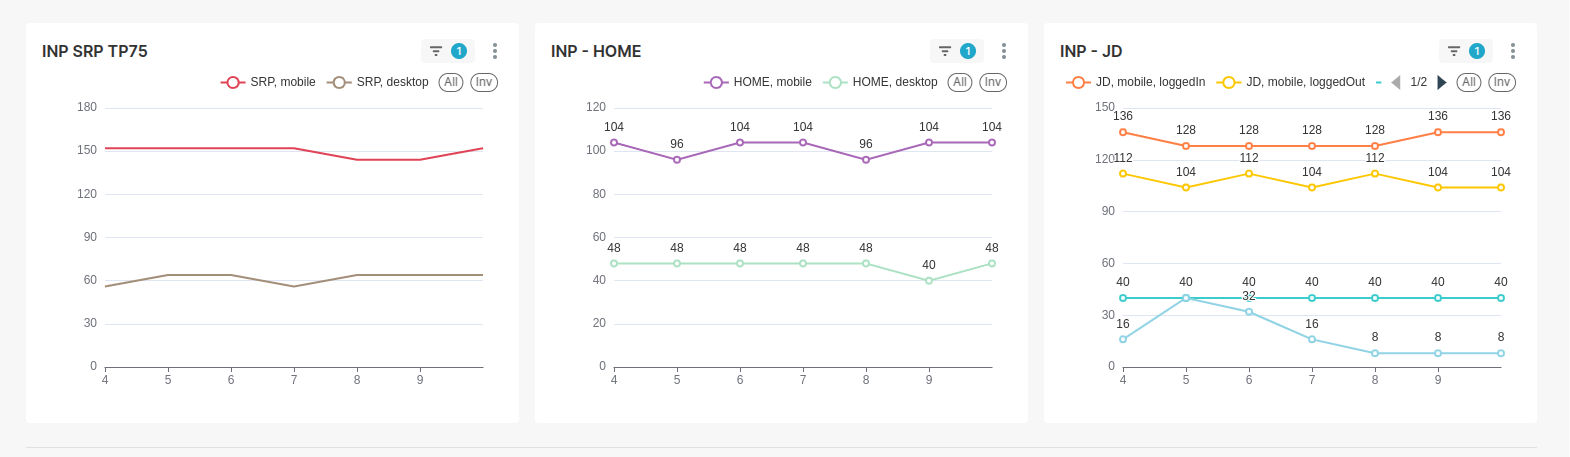
INP Jobs & LCP Job Details

Alert System
Implemented threshold-based alerting system:
- Automatic alerts when metrics exceed "Good" thresholds
- Page-type specific alerting (SRP, JD, Home pages)
- Regression detection comparing current vs historical performance
- Integration with team notification systems
Alert thresholds are configured based on Core Web Vitals "Good" ranges:
- LCP: < 2.5s (Good), 2.5-4.0s (Needs Improvement), > 4.0s (Poor)
- INP: < 200ms (Good), 200-500ms (Needs Improvement), > 500ms (Poor)
- CLS: < 0.1 (Good), 0.1-0.25 (Needs Improvement), > 0.25 (Poor)
Alerts trigger when metrics exceed thresholds for specific page types or user segments.
Attribution Analysis
Deep dive into performance bottlenecks using attribution data:
- LCP element identification and optimization recommendations
- CLS shift source analysis pinpointing layout instability causes
- INP interaction analysis identifying slow JavaScript execution
- TTFB breakdown showing DNS, connection, and server response times
The dashboards show real-world performance data segmented by:
- Page Type: SRP (Search Results Page), HOME, JD (Job Details), Jobs
- Device Type: Mobile vs Desktop performance comparison
- User State: Logged-in vs Logged-out user experiences
- Percentiles: TP75 (75th percentile) showing real user experience
These visualizations enable identification of performance bottlenecks specific to user segments and page types, allowing targeted optimizations.
Key Features
Comprehensive Tracking
Tracks all Core Web Vitals (LCP, CLS, INP, FCP, TTFB) with detailed attribution data for root cause analysis.
SPA Support
Intelligent metric flushing on route changes ensures accurate per-page performance tracking in Single Page Applications.
Device Context
Captures device memory, CPU cores, connection type, and screen dimensions for contextual performance analysis.
Data-Driven Optimization
Analytics dashboards and alerts enable proactive performance optimization based on real-world user data.
Impact & Results
This implementation enabled data-driven performance optimizations that improved the site's Core Web Vitals scores to the "Good" range:
- Identified specific LCP elements causing slow load times
- Pinpointed layout shift sources for CLS optimization
- Detected slow JavaScript interactions affecting INP
- Enabled proactive alerting for performance regressions
- Provided actionable insights for continuous performance improvement